
Sales Conversions (by Rep & by Product)
| Report | Parameters |
|---|---|
| Sales Conversions by Sales Representative | Date From / To |
| Sales Conversions by Product | Date From / To, Sales Reps |
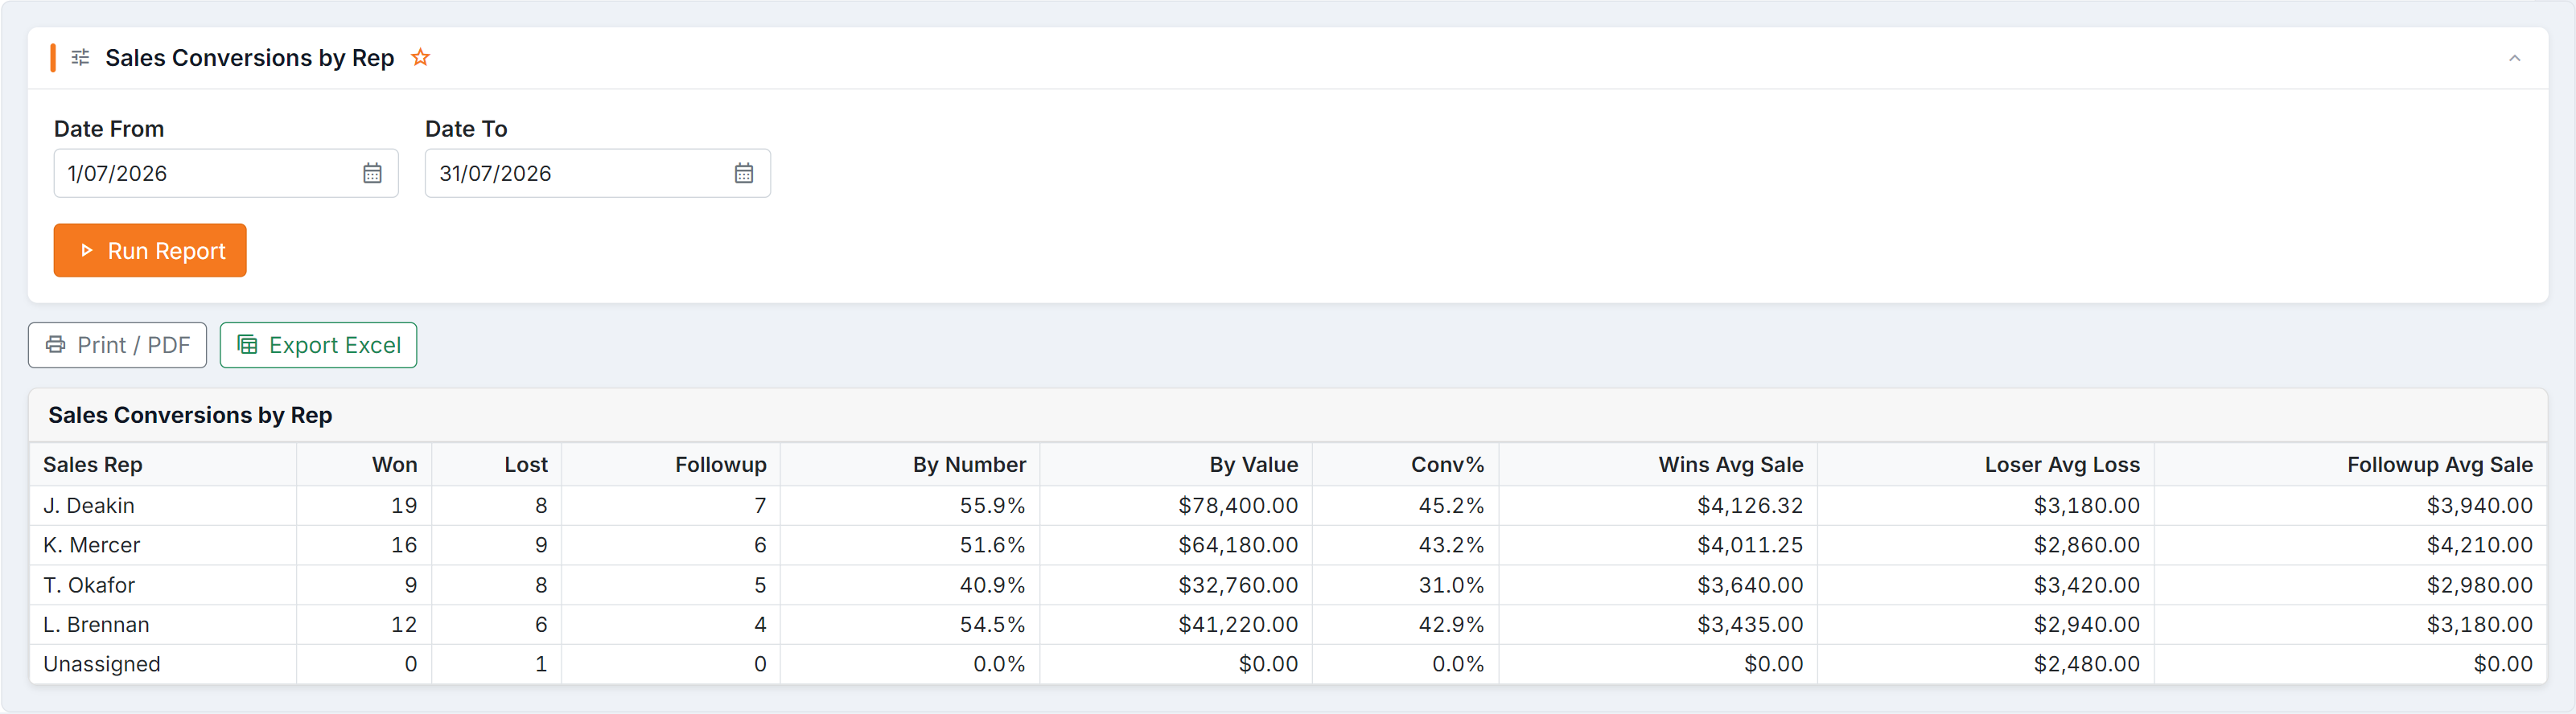
Figure 1 — Sales Conversions by Rep, the richest of the conversion grids. Won / Lost / Followup counts with conversion both By Number and By Value; the three averages — Wins Avg Sale, Loser Avg Loss and Followup Avg Sale — show whether a rep loses the big quotes or the small ones.
Sales Conversions by Sales Representative
Section titled “Sales Conversions by Sales Representative”Columns: Sales Rep · Won · Lost · Followup · By Number · By Value · Conv% · Wins Avg Sale · Loser Avg Loss · Followup Avg Sale
| Column | What it tells you |
|---|---|
| Won / Lost / Followup | Outcome counts — including what’s still open |
| By Number / By Value | Conversion measured two ways: how many, and how much |
| Conv% | The headline conversion rate |
| Wins Avg Sale | Average value of what they win |
| Loser Avg Loss | Average value of what they lose |
| Followup Avg Sale | Average value of what’s still in play |
Followup Avg Sale multiplied by Followup count is roughly your open pipeline value for that rep — worth watching next to Follow-ups Overdue.
Sales Conversions by Product
Section titled “Sales Conversions by Product”Columns: Product · Won · Lost · Followup · Converted
Which products win and which get quoted and lost. Tick one or more Sales Reps (none ticked means all) to see whether a product’s poor conversion is the product or the person selling it.
Common questions
Section titled “Common questions”| Question | Answer |
|---|---|
| Conv% looks too low | Open follow-ups count in the denominator but haven’t been won yet. A rep with a large pipeline reads low until it closes. |
| A rep has zero | No quotes in the window, or outcomes aren’t being recorded on leads. |
| Won + Lost doesn’t equal the total | Followup is the rest — quotes still live. |
| Doesn’t match Lead Conversions | Different stage: these measure quote outcomes, that measures leads becoming orders. |