
Leads Analysis (Summary & by Branch)
| Report | Summarises by | Parameters |
|---|---|---|
| Leads Analysis (Summary) | Sales rep | Date From/To, Sales Reps |
| Leads Analysis by Branch | Branch | Date From/To |
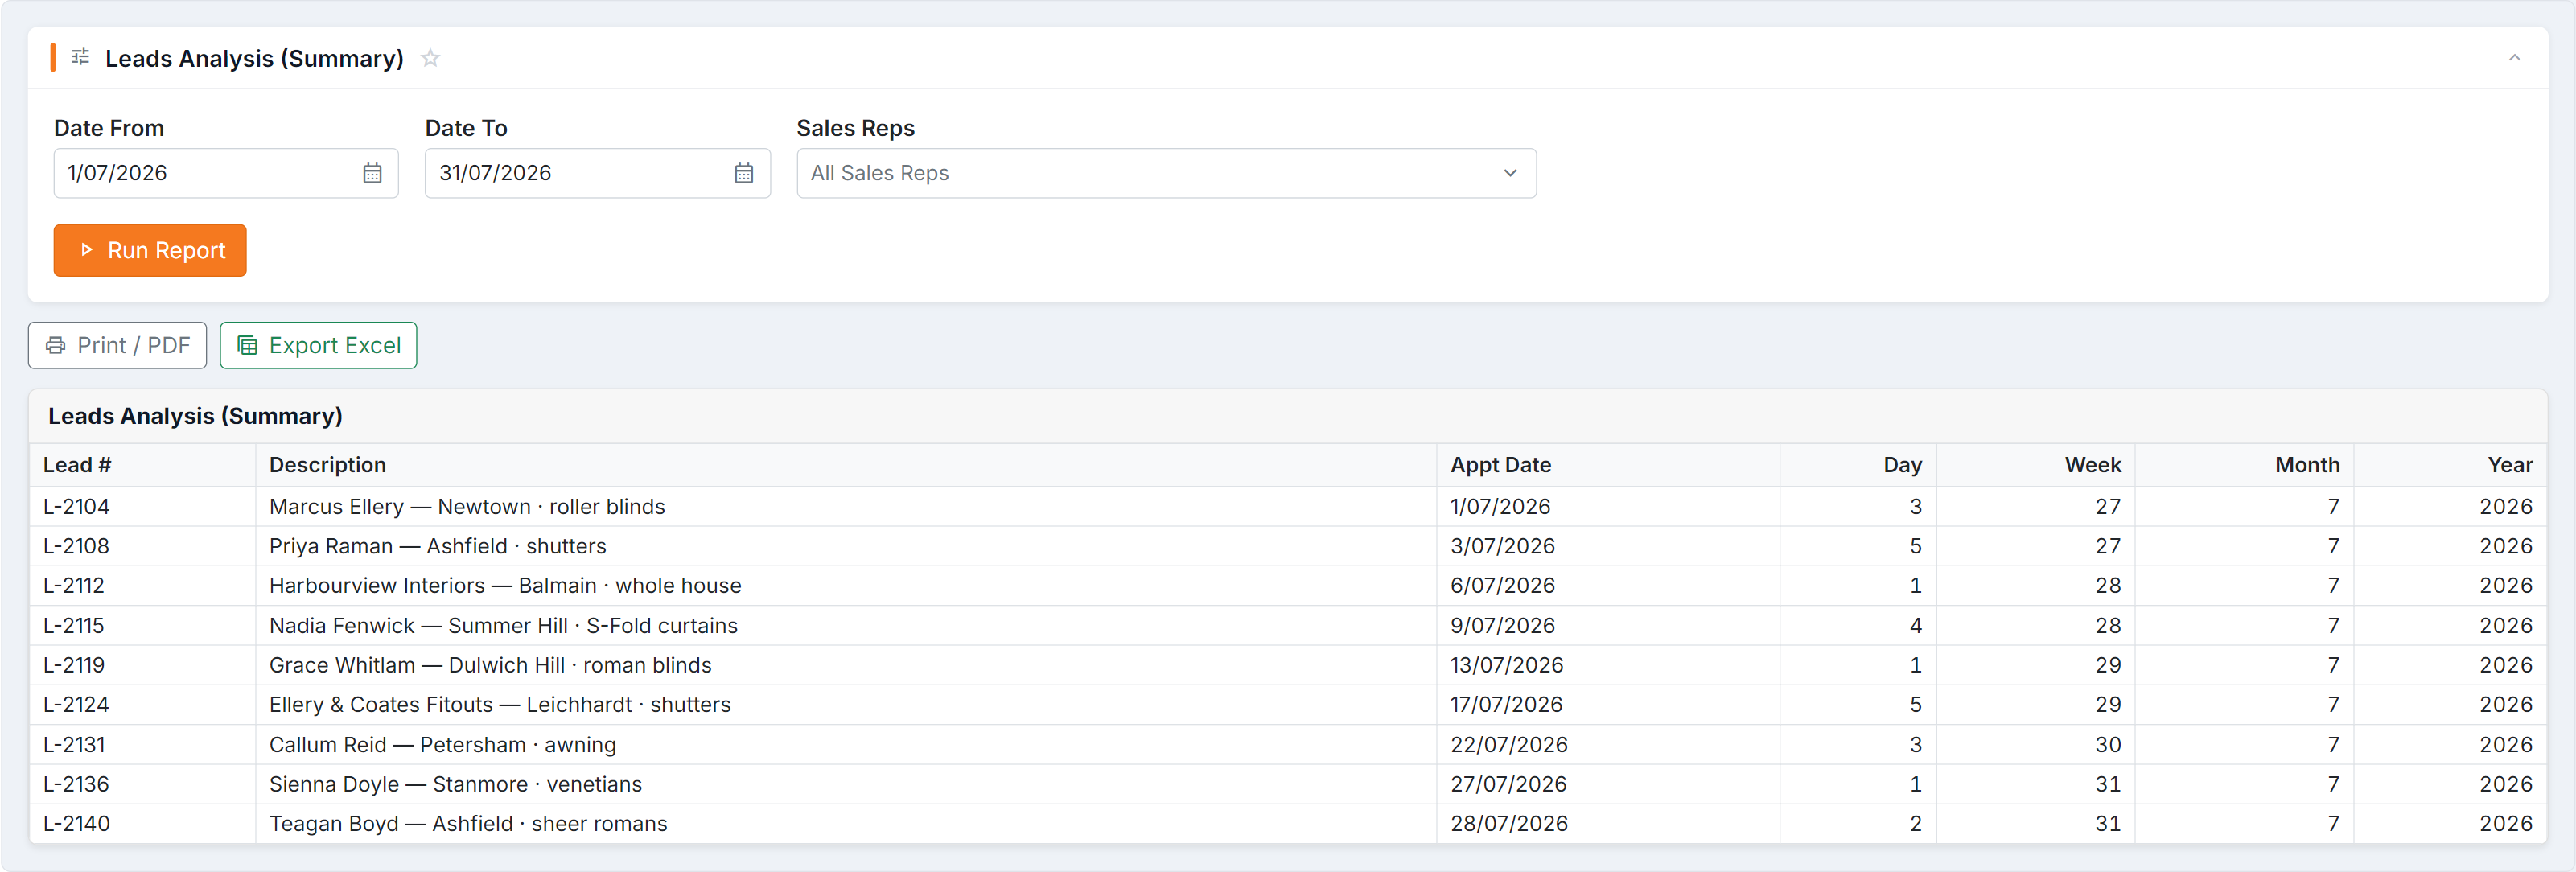
Figure 1 — Leads Analysis (Summary): each lead with its appointment date broken out by Day, Week, Month and Year — the shape you want when you’re counting leads per period rather than reading them one by one.
Columns
Section titled “Columns”Leads Analysis (Summary): Lead # · Description · Appt Date · Day · Week · Month · Year
Leads Analysis by Branch: Lead # · Description · Created Date · Day · Week · Month
Both carry Day / Week / Month (and Year on the Summary) so you can group the same data at whichever interval you need — export and pivot on the one that suits.
How to read them
Section titled “How to read them”- Week-level grouping shows the rhythm; month-level shows the trend.
- Compare branches on the same window to find one that’s under-supplied with leads.
Common questions
Section titled “Common questions”| Question | Answer |
|---|---|
| The two reports disagree | Different date basis — see the note above. |
| A rep has no leads | None assigned in that window, or they’re filtered out. |
| I need the individual leads | Use Leads Analysis (Detailed). |
See also
Section titled “See also”- Leads Sources — where leads come from
- Lead conversions — what happened to them