
Capacity
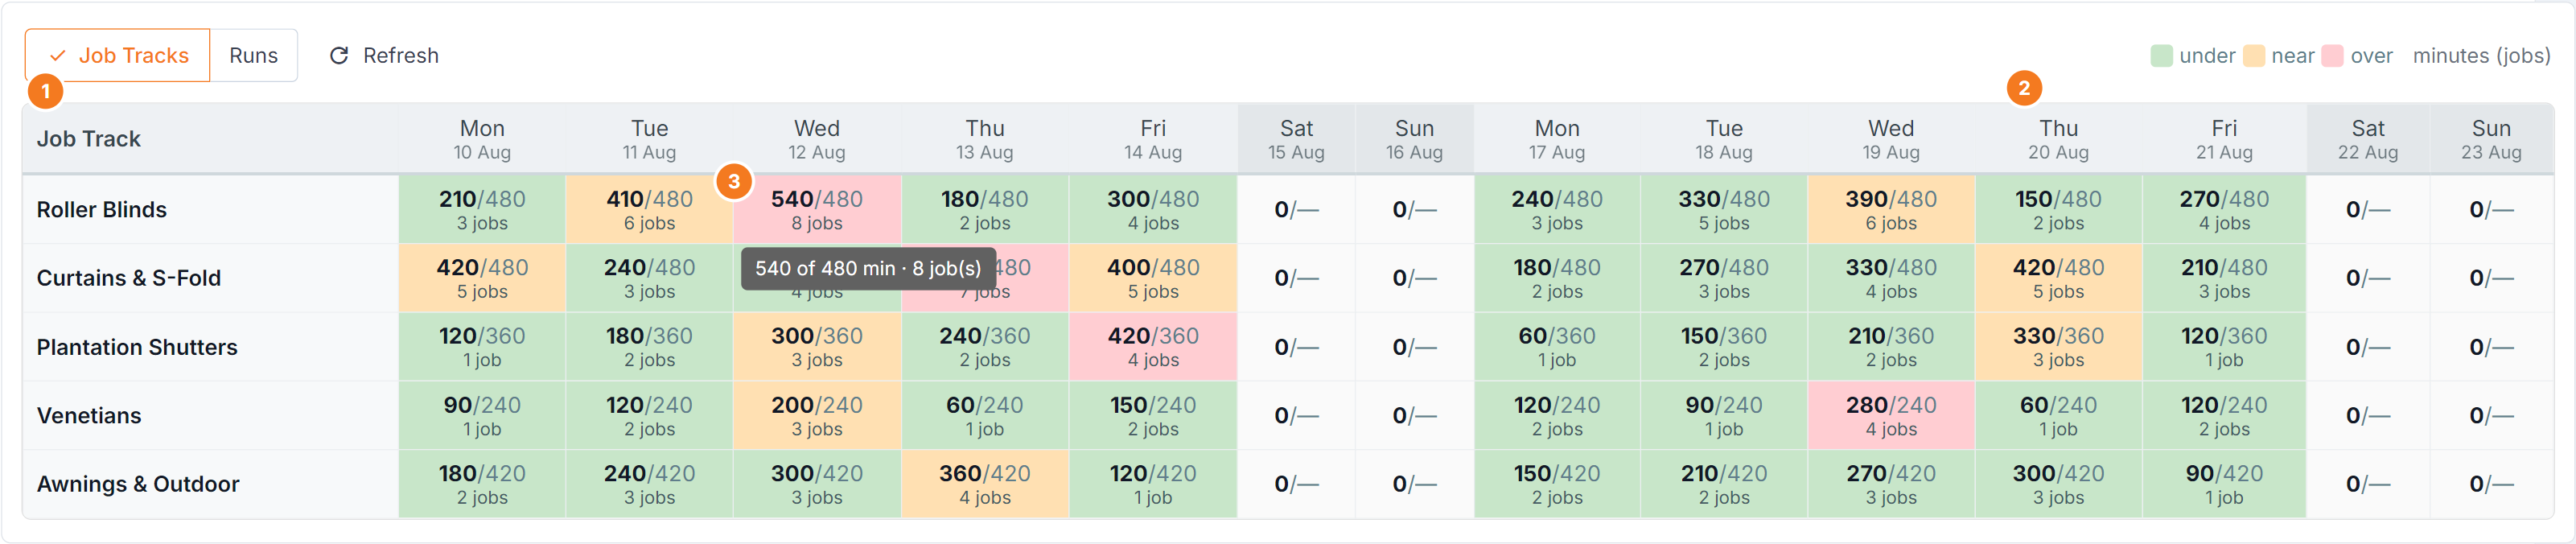
Figure 1 — the capacity heat grid over a fortnight, on the Job tracking side. (1) The rows are Job Tracks on the Job tracking side and Runs on Dispatch; you get them by opening Capacity on that side. (2) The legend reads the colours — under, near, over — and names the unit. (3) Each cell is booked load over capacity with the job count beneath; hover for the detail.
Reading the grid
Section titled “Reading the grid”- Rows — your Job Tracks on the Job tracking side, or your Runs on Dispatch.
- Columns — one per day across your date window. Weekends are shaded.
- Each cell — booked load, then capacity:
210/480. A dash for capacity means none is set. - Below that — how many jobs make up that load.
Cell colour goes from comfortable through busy to over-committed, so you can find the problem days without reading a single number. Hover a cell for the detail behind it.
The row headings and the day headings stay put as you scroll, so you never lose your place in a long list or a wide date range.
Using it
Section titled “Using it”- Ask it on each side — Capacity on Job tracking asks “can we make it in time?”, and on Dispatch it asks “can we fit the install in?”
- Widen the window to a month to find where the pressure eases. Capacity shows up to 3 months at a time.
- A red run with a green neighbour means work needs moving between runs, not pushing out.
Where capacity comes from
Section titled “Where capacity comes from”Capacity is what each job track or run can do per day. If a row shows a dash, no capacity is configured — the load is still counted, but BUZ can’t tell you whether it’s too much.
- Job track capacity — Job Tracking Lines
- Run capacity and working days — Installers
Common questions
Section titled “Common questions”| Question | Answer |
|---|---|
| “No capacity data for this range” | Nothing scheduled in that window — widen the dates or clear filters. |
Every cell shows /— |
No capacity has been set on your job tracks or runs. |
| The numbers look too low | Jobs missing an install or production time contribute little. Check the times on the jobs themselves. |
| A day is red but looks fine | Capacity is per day — a long job booked across one day still lands entirely on it. |