
Products Analysis reports
| Report | Groups by | Answers |
|---|---|---|
| Products Analysis | Nothing (with Dealer) | “What did we sell?” |
| Products Analysis by Branch | Branch | “Which branch sells what?” |
| Products Analysis by Customer | Customer | “What does this customer buy?” |
| Products Analysis by Report Category | Report category | “How are our categories performing?” |
| Products Analysis by Sales Rep | Sales rep | “What does each rep sell?” |
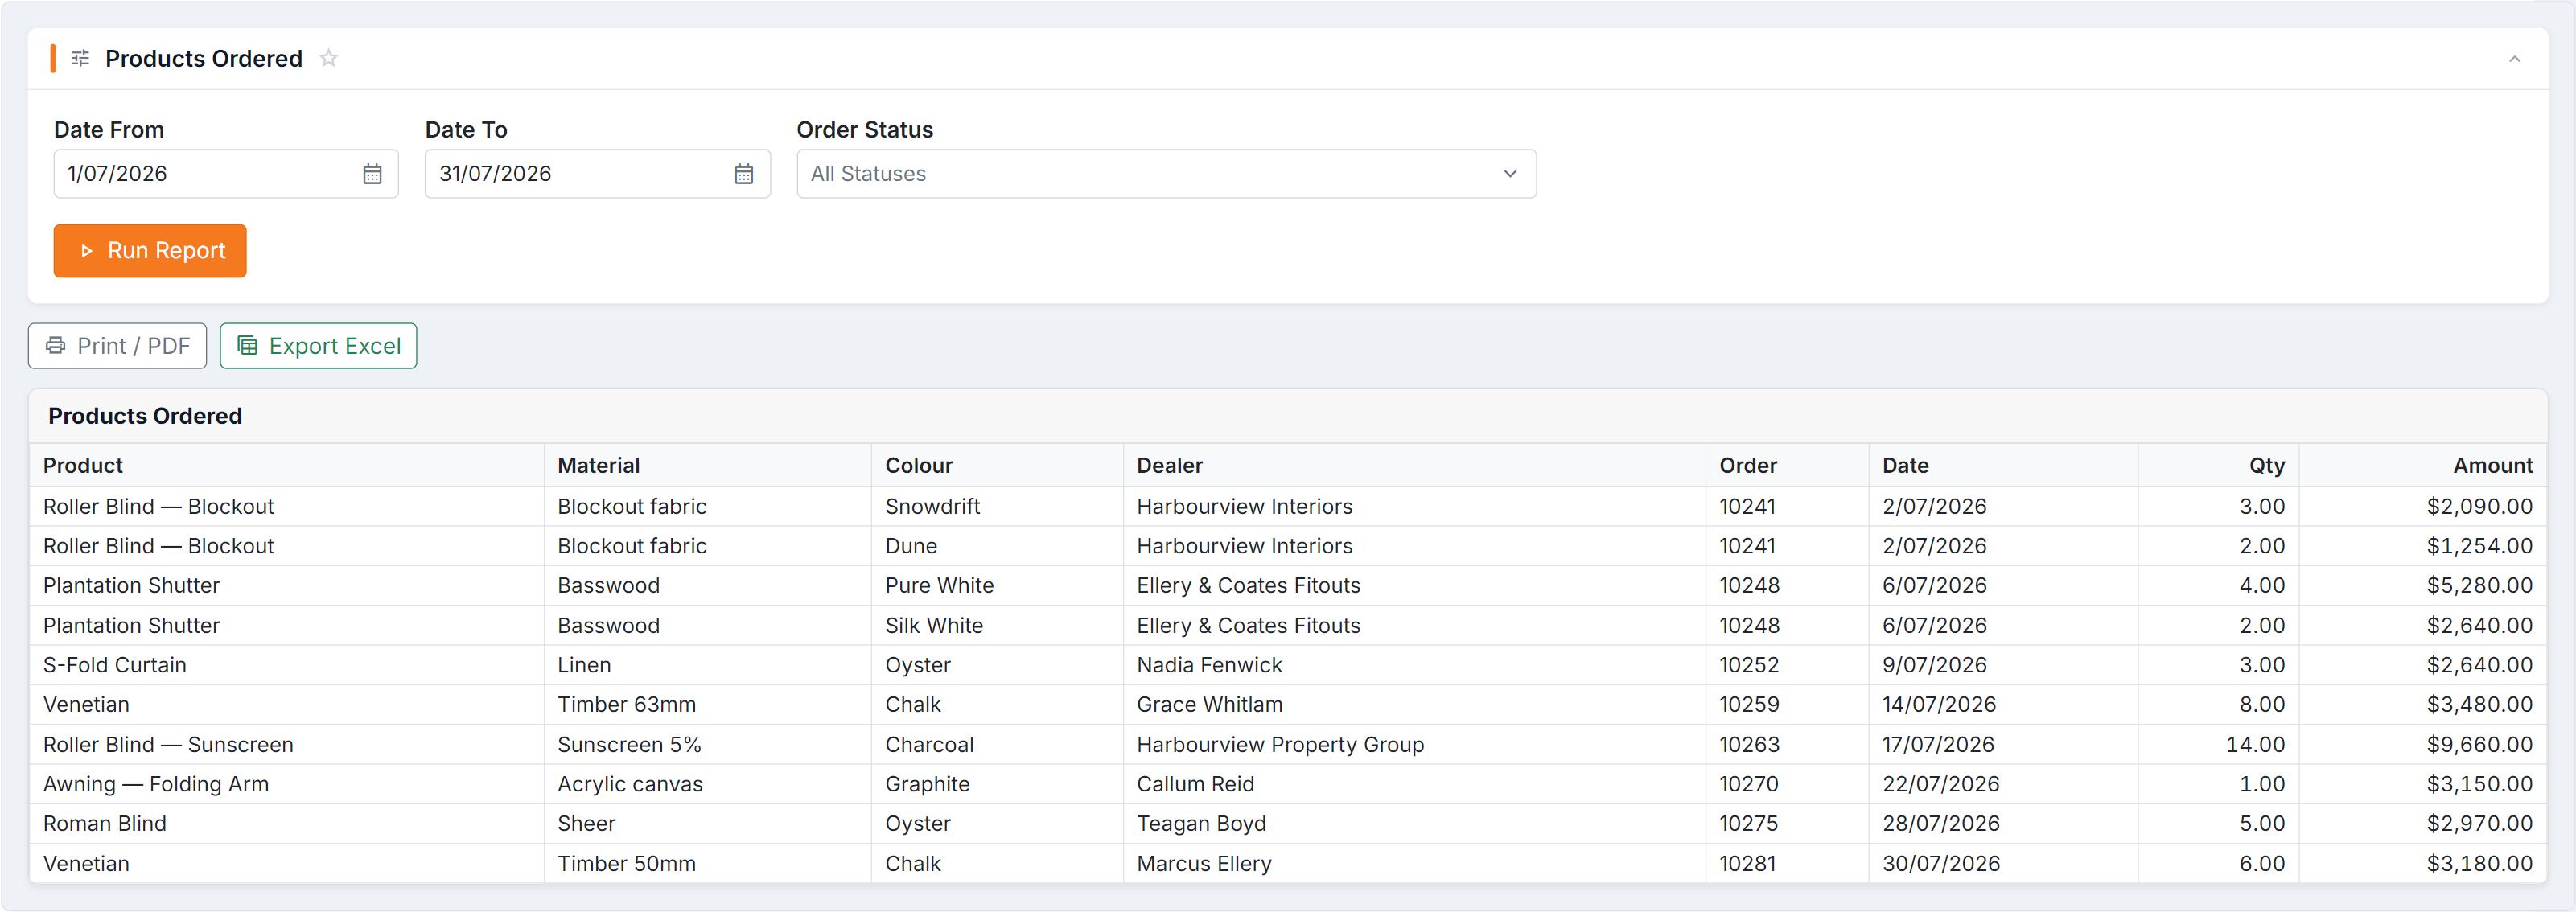
Figure 1 — Products Ordered: one row per product line sold in the period, with its material and colour, the dealer it went to, the order it was on, quantity and amount.
Parameters
Section titled “Parameters”All five take Date From and Date To. Beyond that:
| Report | Also takes |
|---|---|
| Products Analysis | Order Status |
| by Branch | Order Status |
| by Customer | — |
| by Report Category | Sales Reps |
| by Sales Rep | Order Status, Sales Reps |
Columns
Section titled “Columns”The common set: Order · Date · Product · Material · Colour · Qty · Amount, plus the grouping column.
- by Customer adds Accepted Date and Product Group, and reports at product-group level.
- by Branch adds Customer.
- by Report Category and by Sales Rep add Sales Rep.
- Products Analysis adds Dealer.
How to read them
Section titled “How to read them”Material and Colour are the buying columns — combined with Qty, they tell you what stock actually moves.
Common questions
Section titled “Common questions”| Question | Answer |
|---|---|
| Totals differ between two of these | Check the Order Status filter — not all five have it. |
| A product is missing | Nothing sold in that window, or its status is excluded. |
| Numbers don’t match a sales report | Product reports count line items; sales reports count orders. |