
How to run a report
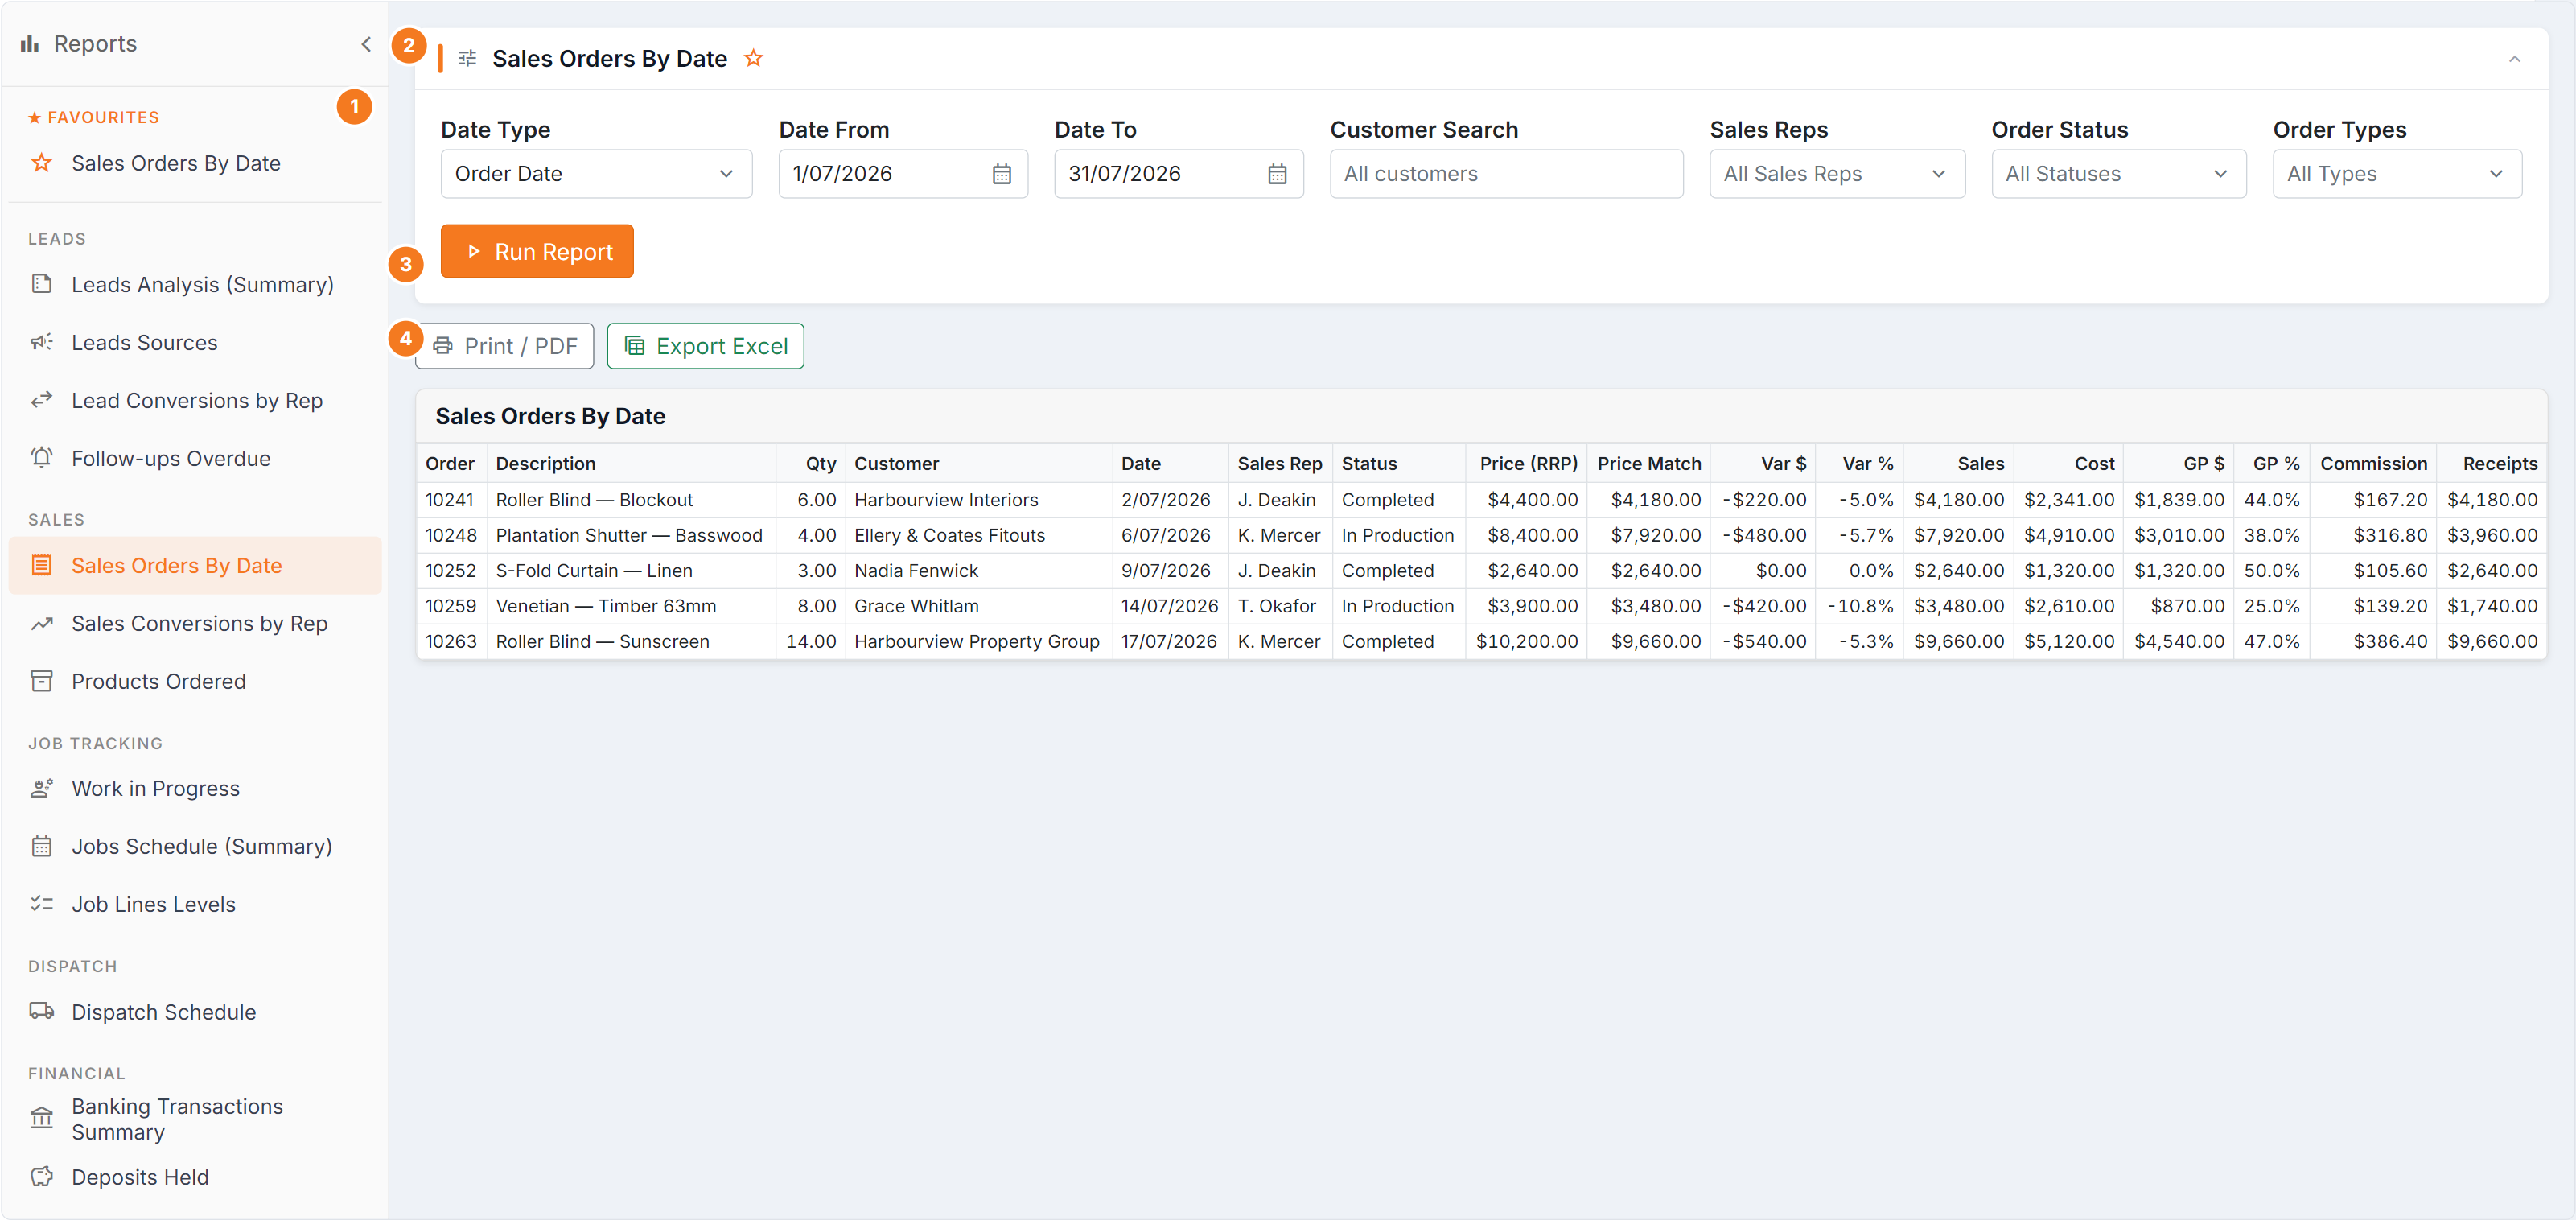
Figure 1 — every report works the same way. (1) The report list on the left, grouped by area, with your favourites pinned on top. Select a group heading to close or reopen that group. (2) The parameter panel — it collapses once the report has run, so select the header to change parameters. (3) Run Report. (4) The export buttons appear after a run: Print / PDF and Export Excel.
- Choose the report from the list on the left.
- Set the parameters in the panel at the top — dates, sales reps, statuses and so on.
- Select Run Report.
- Read the results, or export them.
Parameters
Section titled “Parameters”- Date ranges — nearly every report is bounded by dates. Check which kind of date it uses: some filter on when an order was taken, others on when it’s scheduled or when money was received. The label tells you.
- Multi-selects (Sales Reps, Order Status, Order Types) — leave one empty to include everything. The placeholder says so: All Sales Reps, All Statuses.
- Search boxes (Customer, Installer) — free text, matching part of a name.
Export
Section titled “Export”Once a report has run, export it to work on the numbers elsewhere — into Excel for a pivot table, or to send to your accountant.
When a report comes back empty
Section titled “When a report comes back empty”In order of likelihood:
- The date range — wrong window, or the wrong type of date for that report.
- A filter is too narrow — a rep or status with nothing in it. Clear filters and re-run.
- There genuinely isn’t any data — for example, Banking Transactions Summary is empty until deposit slips exist.
Beyond the built-in reports
Section titled “Beyond the built-in reports”If you need the data sliced your own way, use the OData feed with Excel or Power BI instead of exporting repeatedly.